Amundi ETF S&P 500 UCITS ETF USD
La bourse de Paris ouvre dans 59h13min
500U - LU1681049018 - 
| Cours | Graphes | Sélecteur d'ETF | Historiques |
97,218 €-1,22%
19/04/2024 - 17:35:27
| Volume | 134 763 |
| Ouverture | 97,171 |
| Plus haut | 97,791 |
| Plus bas | 97,171 |
| Clôture veille | 98,423 |
| Volatilité | 0,64% |
| Type de produit | ETF |
| SRD / PEA | Non / Non |
| TTF | Non |
| Cac 40 | 8 022,41 -0,01% |
Dernières transactions
| Heure | Quantité | Cours |
| 17:35:27 | 345 | 97,218 |
| 17:35:27 | 646 | 97,218 |
| 17:35:27 | 646 | 97,218 |
| 17:35:27 | 2 586 | 97,218 |
| 17:35:27 | 87 | 97,218 |
| 17:29:58 | 69 | 97,333 |
| 17:29:58 | 10 | 97,333 |
| 17:29:58 | 25 | 97,333 |
| 17:29:58 | 2 | 97,333 |
| 17:29:50 | 2 | 97,322 |
|
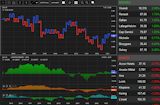
Bougie Barchart |
Présentation de Amundi ETF S&P 500 UCITS ETF USD

Risque (de 1 à 4)
Cet ETF (tracker) est sur une thématique dominante USA, actions, il vise à reproduire au plus près l'indice S&P 500 en utilisant la méthode de réplication Swap synthétique, non financé. Il a été créé le 22 mars 2018 et son encours de 2944 millions d'euros en fait un fonds de taille importante. l'ETF Amundi ETF S&P 500 UCITS ETF USD ne distribue pas de dividendes mais les capitalise.
Carte d'identité de l'ETF
| Thématique | USA, actions |
| Indice de référence | S&P 500 |
| Distribution | Capitalisation |
| Méthode de réplication | Swap synthétique, non financé |
| Encours | 2944 millions € |
| Frais annuels | 0,15% |
| Date de création | 22 mars 2018 |
| Volatilité sur un an | 30,84% |
Les variations historiques
| Plus haut | Plus bas | Vol. moyen | Variation | |
|---|---|---|---|---|
| 1 semaine | 100,5018 | 97,1711 | 37 360 | -3,17% |
| 1 mois | 102,4226 | 97,1711 | 24 040 | -3,54% |
| 1er janvier | 102,4226 | 90,723 | 257 | 5,26% |
| 1 an | 102,4226 | 77,936 | 13 617 | 22,44% |
| 3 ans | 102,4226 | 67,2356 | 16 041 | 24,78% |
| 5 ans | 102,4226 | 39,892 | 15 221 | 84,03% |
| 10 ans | 102,4226 | 30,509 | 16 207 | 212,14% |
| Extrêmes | - | - |
ETF sur la même thématique
| Nom | Encours (M€) | Distribution | Frais |
|---|---|---|---|
| iShares Core S&P 500 UCITS ETF (Acc) | 75 088 | Capitalisation | 0,07% |
| Vanguard S&P 500 UCITS ETF | 37 577 | Distribution | 0,07% |
| SPDR S&P 500 UCITS ETF | 8 212 | Distribution | 0,03% |
| HSBC S&P 500 UCITS ETF USD | 6 056 | Distribution | 0,09% |
| Amundi ETF S&P 500 UCITS ETF USD | 3 995 | Capitalisation | 0,15% |
 Suivez les marchés avec des outils de pros !